Out of Overload

A Guide for Technical Managers

Chapter 7
Modeling

The Seven and Three Rule
Modern Rule Breakers

Process Modeling
Presenting the Process Model

Additional Reading

Modeling translates complex situations into pictures. The visual nature of seeing the items on paper allows you to use your visual analysis abilities. As humans, surveying a scene or studying a representational map is a part of our survival skills.

Having items represented as figures is in itself a simplification. If written out in full, a single summary box might need two pages of text in explanation. And, as one of your standard overload strategies, putting it down on paper gets it out of your head.

The Seven and Three Rule

When you first sketch out the elements of a particular issue, it’s best to be free flowing, something like brainstorming. Get the ideas flushed out.

Before moving to any analysis or consideration of issues, you need to structure the model so that the mind can process the information. At the crudest level, this means consolidating items into groups of seven or less. The concept of a natural overload at greater than groups of seven surfaced in the fifties and has had impressive results with information recall. (G.A. Miller, "The Magic Number Seven, plus or minus two. Some limits on our capacity for processing information." Psychological Review, 1956, 63, 81-96.)

When you exceed the number of items/issues your mind can consider, there is no gradual drop off in efficiency. Mental overload stops your thinking process. It drops to zero. You literally go blank. Most people resume thinking pretty quickly, but at that point the mind is struggling. It’s trying to regroup and consolidate the items into a configuration that gets it out of overload. Sometimes it will recover, other times it won’t.

For example:

Bob felt he had some kind of mental block on these UML symbols. He’d read about them, but nothing would stick.

The Three Rule

If your groupings require decision making, they need to be further consolidated into groups of three or less. Groups of seven are fine for to-do lists and straight recall, but for the mind to actively manipulate issues, it needs them in groupings of three. Since each element of three can expand into its own sub-group, this breakout can still handle a good range of complexity.

For example:

Anne was curious about the numbers. If each group could handle three more categories, how many layers would it take to handle a complex situation?

Limiting the breakout to groups of three, she calculated 3 to the n power. 3, 9, 27, 81, 243, 729, 2187. An n of 7 produced 2187 -- that seemed like a reasonable size. Anne also realized that if any one of the threads fell into the Sevens’ Group, the number would be much larger.

The distinction between when seven is okay and when three is needed is not always clear. It depends on how you are considering the items.

For example:

Lou sketched out his software development model:

1. Requirements.
2. Design.
3. Review.
4. Code.
5. Test.
6. Support.

As he considered day-to-day flow, this model seemed adequate. However, when he needed to think through strategic factors, this list didn’t seem to fit. Lou reworked it into:

A. Design.
- Requirements.
- Design.
- Review.
B. Production.
- Code.
- Test.
C. Implementation.
- Support.

The issues were the same, but Lou could actively contemplate these in a larger context.

A. Design.
B. Production.
C. Implementation.

The distinction between three and seven groups is subtle, but the results are not. The right groupings allow you to think clearly; the wrong groupings slow you down. You will notice the difference instantly.

Modern Rule Breakers

Several modern theorists, of whom Edward Tufte is good example, use eye catching graphics to reduce complexity into a one page representation. They have the ability reduce a war or a stack of statistics down to several images, often enabling you to grasp the situation at a glance.

These models work best when the key graphics fall within the Seven and Three Rule.

For example:

The model might include:

1. Flow across the page.
2. Images that change size.
3. Groups of spike patterns.

Or:
1. Three clouds.
2. Time as movement from left to right.

The mind absorbs three graphic images easily.

There are times, however, when the modern modeling theorists break the rules and get away with it. Let's say they represent three types of river flow as three cloud images on a page. So far, so good. Next, they fill the clouds with 15, 25, and 10 flow patterns. These clearly exceed the limits of the Seven and Three Rule, and as a result, you would shift into overload when you tried to learn the flow pattern details.

In these mixed cases, the benefits of the simple groupings are substantial and lasting. No one can read Tufte's books with having a more clear view of the European wars. If you must focus on the details within any of these sections, however, overload returns and comprehension suffers. Fortunately for the rule breakers, their point in the presentations is carried by the big picture and the simple graphics. Typically, their audience is not concerned with details at that point, and the model is successful.

Process Modeling

Where other forms of modeling are somewhat free form, process modeling consolidates actions around categories of activities. This form of collecting and categorizing smaller tasks is perfect for reducing overload.

One of Modeling’s notable proponents, Edward Yourdon, suggests that collections of action are processes that interact and share information. Although Mr. Yourdon then used these structures for an introduction to Object-Oriented Design, graphically representing processes helps reduce overload.

The procedure for Process Modeling includes:

1. Listing.
2. Grouping.
3. Identifying the process associated with each group.
4. Connect the processes.

1. Listing.

The first step in consolidating overloaded activities is to list the elements. Put every action that comes to mind down on paper. Some like to use yellow stick’em sheets, as they are easy to move around; others put the list right into a PC.

For example:

Tony couldn't believe his good luck. He was getting the Smith account -- it could push his commissions into six figures. The problem was he knew almost nothing about rubber, and when he looked at the manuals, his head went into a spin. Tony hoped a Process Model would help him absorb enough to speak intelligently with George, the Smith plant manager.

Tony began by listing all tasks involved with the operation. Order didn't matter, he just want to get them down on paper.

- Change the dyes.
- Replace the paddles.
- Find best costing mix.
- Use up what's left.
- Handle the PC crashes.
- Train the staff on the latest chemistry.
- Store the run data.
- Print out daily reports.
- Limit staff access to the systems.
- Maintain industry standards.
- Track the vendors’ response.
- Adjust the mixtures in real-time.
- Distribute the data.
- Schedule and assign tasks.
- Check out-of-tolerance alarms.
- Analyze old data for trends.
- Fix equipment failure.
- Track environment stability.
- Handle any software bugs.

2. Grouping.

Collect like items and group into similar categories.

For example:

The list seemed scattered, but Tony felt it was complete. To regroup the items, he placed a symbol by similar items.

@ Change the dyes.
# Track the vendors’ response.
% Replace the paddles.
@ Adjust the mixtures in real-time.
** Find best costing mix.
@ Use up what's left.
+ Schedule and assign tasks.
= Handle the PC crashes.
^ Store the run data.
+ Train the staff on the latest chemistry.
$ Analyze old data for trends.
@ Check out-of-tolerance alarms.
** Print out daily reports.
? Distribute the data.
+ Limit access to the systems.
$ Track environment stability.
-- Maintain industry standards.
% Handle any software bugs.
% Fix equipment failure.

Then Tony grouped them by symbol.

@ Change the dyes.
@ Adjust the mixtures in real-time.
@ Use up what's left.
@ Check out-of-tolerance alarms.

% Replace the paddles.
% Handle any software bugs.
% Fix equipment failure.

** Find best costing mix.
** Print out daily reports.

$ Analyze old data for trends.
$ Track environment stability.

+ Schedule and assign tasks.
+ Train the staff on the latest chemistry.
+ Limit access to the systems.

# Track the vendors’ response.

= Handle the PC crashes.

^ Store the run data.

? Distribute the data.

-- Maintain industry standards.

"Well," Tony thought, "not bad for a first try." Five key groups were surfacing. He hoped the stragglers would fit into those.

Tony tried to blend in the stragglers.

@ Change the dyes.
@ Adjust the mixtures in real-time.
@ Use up what's left.
@ Check out-of-tolerance alarms.

% Replace the paddles.
% Handle any software bugs.
% Fix equipment failure.
# Track the vendors’ response.
= Handle the PC crashes.
? Distribute the data.

** Find best costing mix.
** Print out daily reports.

$ Analyze old data for trends.
$ Track environment stability.
^ Store the run data.

+ Schedule and assign tasks.
+ Train the staff on the latest chemistry.
+ Limit access to the systems.

-- Maintain industry standards.

He ended up adding a Standards group. Everything else fit into the earlier groups.

3. Identifying each group’s process.

Next, analyze the groups for the heading that best captures that section’s essence.

For example:

The categories came easily to Tony:

Manufacturing

@ Change the dyes.
@ Adjust the mixtures in real-time.
@ Use up what's left.
@ Check out-of-tolerance alarms.

Product Management
% Replace the paddles.
% Handle any software bugs.
% Fix equipment failure.
# Track the vendors’ response.
= Handle the PC crashes.
? Distribute the data.

Quality Analysis

** Find best costing mix.
** Print out daily reports.

Maintenance

$ Analyze old data for trends.
$ Track environment stability.
^ Store the run data.

Staff Development

+ Schedule and assign tasks.
+ Train the staff on the latest chemistry.
+ Limit access to the systems.

Standards Administration

-- Maintain industry standards.

Trying to simplify even further, Tony regrouped the headings themselves:

Product

- Manufacturing
- Management
- Quality Analysis

Maintenance

- Equipment Maintenance

Administration

- Staff Development
- Standards Administration

This last outline seemed manageable. The entire operation was less overwhelming. Tony now felt he could study one section at a time and not get lost.

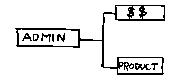
4. Connecting the processes.

Connecting the processes describes their relationship graphically. At a glance, it becomes possible to identify interactions and dependencies.

This example may be more simple than your operation. However, the same principles apply to complex operations. Representing processes graphically makes it easier to understand operations and solve problems.

Presenting the Process Model

Customers love to talk about their business. The discussions, however, must be knowledgeable exchanges. Customers have had enough blank looks from non-technical sales people -- they want to talk nuts and bolts.

A Process Model is the perfect vehicle for that discussion. Within seconds, as the customer glances over the diagrams, the customers sees that you know their business. At that point you become an insider. No need for a slide show or brochures, you are one of them.

For example:

After the first couple of visits using a Process Model, Tony wondered whether he was really needed in these sales contacts. Customers would pull the model out of his hands and ignore him as they studied it. Common statements were:

George said half to himself, "I forgot that all these samples go through inspections before being stored. That could be the source of the problem."

"This is nice. The interaction between inventory and the floor staff really stands out."

"I can see how important that database is to us. We should change our procedures to make sure it's operating correctly."

Even when there wasn't much sales discussion, a strange thing began to happen. The customers started bringing up details on future orders. Tony hadn't even pitched the units. He thought, "This was the ideal -- kick around operations issues a bit and agree to send a quote. It hardly felt like sales."

-------

Tony knew the big test would be the Smith account. He was going in with a product 20% higher than the competitors and would be justifying it with a "better service concept." He had 30 minutes of George Smith's time.

After 10 minutes of light conversation, Tony had the sense that he was being brushed off. Their discussion just wasn't focusing on anything. His chances were sinking fast.

At 15 minutes, something on page eleven of the Process Model caught George's attention. It loosened a flood of questions: "How did you come up with this? What are the assumptions? How does this simplify?..." The questions flew over the next half hour.

George paused. His gaze shifted from Tony to the table of notes and diagrams. "This was useful," he said steadily. "There are some angles here I hadn't considered in a while. Thanks for coming by. If you could consolidate the items we discussed, I'd be interested in what it looks like."

"It'd be my pleasure," Tony responded with hope starting to build.

On the way to the door, George said, "Can you rework those product numbers to cover three units for ten plants over two years with some sort of reasonable discount?"

Tony couldn't help but smile, "Will do. I'll give you a call next week."

Technology environments are complex, and overload abounds. To have someone reduce that complexity is a most welcome gift.

Process Models change the way things appear. Seeing the sections and interactions on paper makes the gaps jump out. Repetitive functions become obvious. Models elicit clarity, and as such, they are a powerful tool against overload.

Additional Reading

Object-Oriented Analysis: Objects in Plain English by David Browne. Wiley, 1997.

Structured Design : Fundamentals of a Discipline of Computer Program and Systems Design by Edward Yourdon. Prentice Hall, 1986.

Object-Oriented Modeling and Design by James Rumbaugh et al. Prentice Hall, 1991.

Object-Oriented Information Systems, Planning and Implementation by David Taylor. Wiley, 1992.

Visual Explanations: Images and Quantities, Evidence and Narrative by Edward R. Tufte. Graphics Press, 1997.


Go to: | AWSS Main | Previous Chapter | Next Chapter | Feedback: jdavis@awss.com